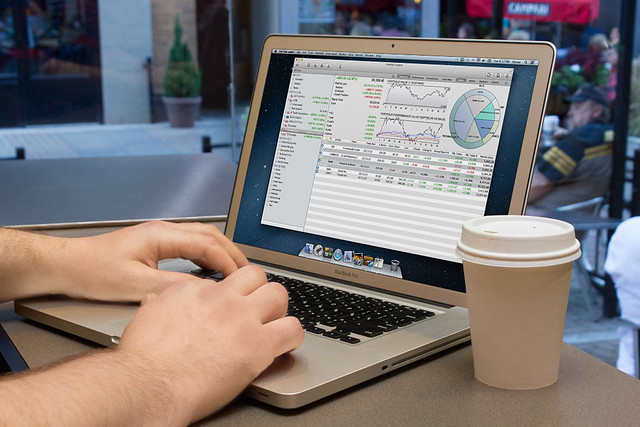
Investors and traders use stock market indicators to analyze a stock’s price and volume movement patterns and use these to predict future trends. Understanding the basics of these indicators can help you become more skilled at trading on the stock market on a day-to-day basis. Here are four types of stock market indicators you need to know about:
Trend Indicators
With trend indicators, you can analyze the market and find out if the stock you are trading has an upward, sideways, or downward price trend. That can help you to decide if you need to buy or sell the stock. Some of the commonly used trend indicators are moving averages, forecast oscillator, linear regression, average directional index, parabolic stop and reverse (parabolic SAR), and moving average convergence divergence (MACD).
Momentum Indicators
Momentum indicates how fast the value of stocks moves within a particular period. They are oscillating indicators with 0 to 100 key levels that compare current closing prices with previous ones and use the calculation to identify the speed and the direction in which a high volume of the stocks move. You can use the indicators to find out if they are overbought or oversold. If the momentum indicator and price diverge, it means that future prices can change.
Traders and investors often use momentum indicators with other market indicators like moving averages to generate more signals on price movements. Some momentum indicators are relative strength index (RSI), stochastic oscillator, and commodity channel index (CCI).
Volatility Indicators
Volatility indicators track the up and down movements of stock prices over a specified period. If the stock price movement occurs quickly over a short time, it means that the market is volatile. However, if the price movement is sluggish, it means it is a low volatility market. If you want more trading opportunities and more volume, volatile markets are the best. Low volatility markets, on the other hand, are likely to be less profitable and will also make it difficult for you to convert your stocks into cash.
Some of the volatility indicators that traders and investors use include Bollinger Bands, volatility channel indicators, projection oscillator, standard deviation, and average true range.
Volume Indicators
Typically, strong trends and large movements in stock prices occur after the trading volume of several contracts for a stock or an asset increases in a specific period. With volume indicators, you can measure how strong a trend is and also find out whether the price is going up or down. Having this information can help you find more trading opportunities. Some volume indicators that traders and investors use are on-balance volume (OBV), volume rate of change, and Chaikin oscillator.
When using these market indicators, it will help to first learn exactly what each does and why picking one rather than another may benefit you more. After you understand how they work, pick two or three that complement one another. Once an indicator suggests a trend, you can use the other indicators to confirm it.


Leave a Reply